Transform Data Into Decisions

I enjoy working across the entire analytics process, from collecting and cleaning raw data to validating its accuracy, exploring trends, building predictive models, and creating dashboards that help leaders make informed decisions. Whether developing interactive Tableau dashboards, building Power BI reports, writing Python programs for data analysis, or querying databases with SQL, my goal is always the same: transform data into information that people can understand and use.

Some of the projects featured in this portfolio include business process analysis, government contract data analysis, financial and budget reporting, machine learning models, customer sentiment analysis, and interactive business intelligence dashboards. Every project emphasizes data integrity, thoughtful analysis, and practical recommendations designed to improve organizational performance.

My technical toolkit includes Python, SQL, Tableau, Power BI, Microsoft Excel, and statistical analysis techniques. I am continually expanding my skills in machine learning, automation, and artificial intelligence to stay current with the rapidly evolving field of analytics.

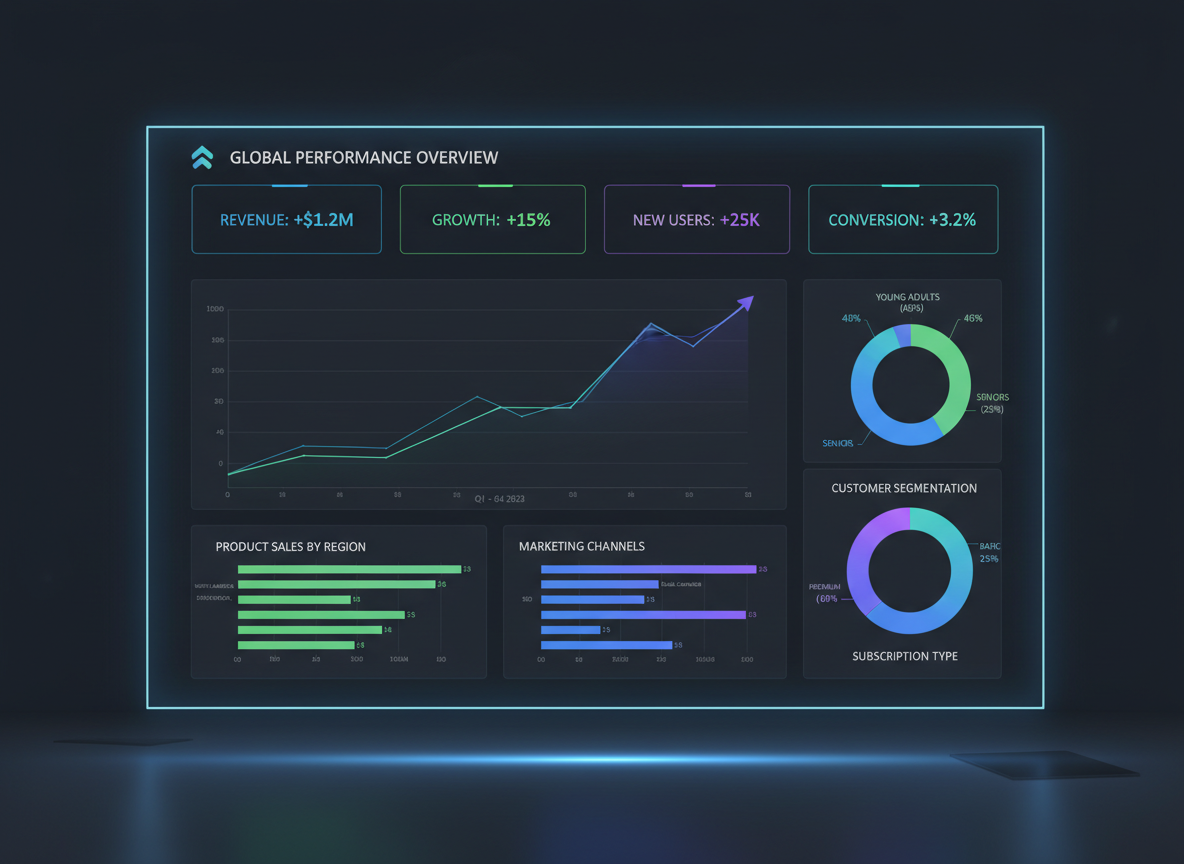
A sleek, modern analytics dashboard UI with multiple chart types: a line graph showing upward growth trends, bar charts, pie charts, and KPI metric cards. Clean dark background with vibrant blue, green, and purple accent colors. Professional data visualization aesthetic with realistic-looking data.

Data Analytics Professional

RACHEL SMITH

Business Analytics | Data Visualization | Financial Analysis | Python | SQL | Tableau | Power BI

I transform complex data into actionable business insights through analytics, automation, and interactive dashboards. My experience combines business operations, financial analysis, Python programming, SQL, Tableau, and Power BI to solve real-world problems while maintaining data integrity and clear executive reporting.

Beyond technical skills, I believe successful analysts are effective communicators. Numbers alone do not create value—clear explanations, compelling visualizations, and actionable recommendations do. I enjoy bridging the gap between technical analysis and business strategy by presenting complex information in ways that help decision-makers act with confidence.
Rachel Smith
Analytics dashboard showing multiple chart types including line graphs, bar charts, pie charts, and KPI metric cards on a dark background with vibrant accent colors

Skills & Tools

The stack behind the insights

About Me

Always learning, always building

My technical toolkit includes Python, SQL, Tableau, Power BI, Microsoft Excel, and statistical analysis techniques. I am continually expanding my skills in machine learning, automation, and artificial intelligence to stay current with the rapidly evolving field of analytics.

Get in touch

(503)435-9557

joylikerachel@gmail.com